

Why the Right Data Analytics Tools Can Transform Your Career in Australia
If you’re trying to figure out which data analytics tools to learn in 2026, you’re asking exactly the right question. The Australian data analytics job market is growing faster than almost any other tech sector right now and employers aren’t just looking for someone who “knows Excel” anymore. They want professionals who understand the right tools, can work with real data, and deliver insights that drive business decisions.
The good news? Data analytics salaries in Australia currently range from around $70,000 to $115,000+ per year depending on your skills and city. Data analyst roles are in strong demand in Melbourne, Sydney, Brisbane, Perth, and Adelaide and the number of positions is only growing as more Australian businesses invest in data-driven decision-making.
The challenge is that there are dozens of data analytics tools out there and not all of them are worth your time, especially when you’re just starting out. Learning the wrong tools in the wrong order is one of the most common mistakes we see from students across Australia.
That’s exactly why we put this guide together. At Data Analytics Courses AU, we’ve helped thousands of Australians build job-ready data analytics skills, and in this post, we’re sharing the top 7 data analytics tools you should focus on in 2026, ranked from beginner to advanced, along with a clear learning path to follow.
Why Choosing the Right Data Analytics Tools Actually Matters
Not all data analytics tools are created equal, and not all of them are relevant to every job role or industry. Companies across Australia rely on these tools to get real-time insights, automate reporting, and make faster, better-informed decisions. If you learn tools that aren’t in demand, you risk spending months studying something that won’t help you get hired.
Here’s why choosing the right data analytics tools from the start makes such a big difference:
- Faster job placement: Employers are looking for specific tool experience. The right skills on your resume open doors much faster.
- Higher salary potential: Professionals with Python, SQL, and Power BI skills command significantly higher salaries than those with basic spreadsheet skills alone.
- More versatility: The tools in this list are used across industries from retail and finance to healthcare and government giving you flexibility in where you work.
- Confidence in interviews: Being able to talk confidently about the data analytics tools you know and why you chose them is a major advantage in any job interview.
Let’s get into the list.
Top 7 Data Analytics Tools to Learn in 2026 (Ranked Beginner to Advanced)
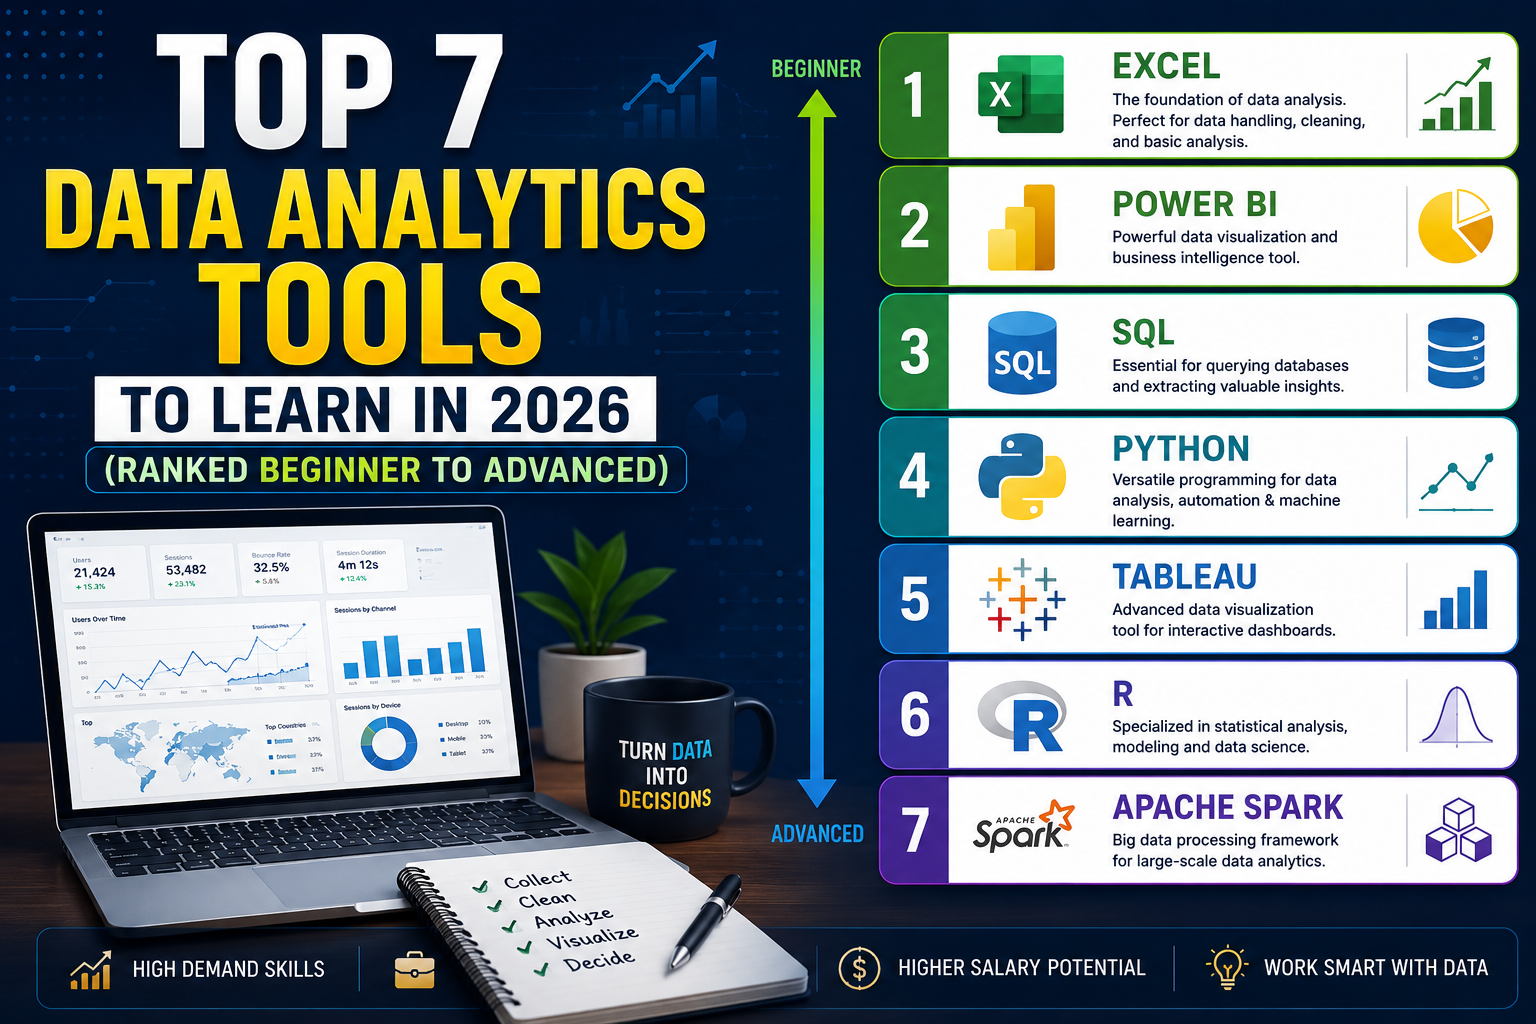
1. Microsoft Excel The Essential Data Analytics Tool for Beginners
No list of data analytics tools would be complete without Microsoft Excel. Despite being one of the oldest tools in the list, Excel is still used in over 80% of Australian workplaces across every industry. If you’re brand new to data analytics, this is absolutely where you should start.
Excel lets you clean and organise raw data, build PivotTables and summary reports, create charts and visualisations, and use functions like VLOOKUP, INDEX/MATCH, and SUMIF to analyse data without writing a single line of code. It’s also the tool most hiring managers expect every candidate to know at a baseline level, whether you’re applying for a data analyst role in Sydney or a marketing analyst position in Melbourne.
- Best for: Data cleaning, reporting, dashboards, beginners
- Difficulty: Beginner
- Australian demand: Very high required in most job ads across all industries
Our Excel for data analytics course is one of the most popular courses we offer and is a perfect starting point for anyone new to data analytics tools in Australia.
2. SQL The Backbone of Every Data Analytics Role
Once you’ve got Excel down, SQL (Structured Query Language) is the next essential data analytics tool to learn. SQL is how you talk to databases — and nearly every organisation in Australia that works with data uses a database of some kind. Whether it’s customer data, sales records, website behaviour, or financial transactions, SQL is how analysts access and interrogate it.
The great thing about SQL is that it’s surprisingly approachable for beginners. You don’t need a computer science degree to write SQL queries. Within a few weeks of focused study, most people can write queries to filter, join, group, and summarise datasets that would take hours to manage manually in Excel.
- Best for: Database querying, data extraction, business reporting
- Difficulty: Beginner to intermediate
- Australian demand: Extremely high mentioned in the vast majority of data analyst job ads in Brisbane, Perth, and nationally
3. Power BI Australia’s Most In-Demand Dashboard Tool
Power BI is currently one of the hottest data analytics tools in the Australian market, and it’s not hard to see why. It integrates seamlessly with Microsoft 365, Excel, and Azure which means any organisation already using Microsoft products can adopt Power BI without overhauling their entire tech stack.
With Power BI, you can connect to dozens of data sources simultaneously, build interactive dashboards that update in real time, and share reports with stakeholders who don’t need any technical knowledge to use them. For anyone working in finance, operations, HR, or business intelligence in Australia, Power BI experience is becoming a must-have on the resume.
- Best for: Business dashboards, real-time reporting, Microsoft-heavy workplaces
- Difficulty: Intermediate
- Australian demand: Very high and growing rapidly, especially in Melbourne and Sydney corporate environments
4. Python The Advanced Data Analytics Tool That Opens the Most Doors
If you want to maximise your earning potential with data analytics tools, Python is the one to focus on at the advanced level. Python is the most widely used programming language in data analytics and data science worldwide, and Australian employers are increasingly listing it as a required or preferred skill especially for senior analyst, data scientist, and machine learning roles.
Python allows you to automate repetitive data tasks, work with datasets that are far too large for Excel, build machine learning models, create advanced visualisations, and scrape data from the web. The learning curve is steeper than Excel or Power BI, but the career payoff is significant. Data professionals with strong Python skills in Australia can earn well above $100,000 per year.
- Best for: Automation, machine learning, large dataset analysis, advanced analytics
- Difficulty: Intermediate to advanced
- Australian demand: High and growing, particularly in Sydney tech companies, fintech, and government data roles
5. Tableau The Gold Standard for Data Visualisation
Tableau has been one of the leading data analytics tools for data visualisation for over a decade, and it remains a strong skill to have in 2026. It’s particularly well-regarded in industries like retail, healthcare, and consulting, where the ability to present data in a visually compelling way to non-technical stakeholders is highly valued.
Tableau’s drag-and-drop interface makes it more accessible than Python for visualisation, and the finished dashboards are genuinely impressive — the kind that make executives lean forward in their chairs. If you’re torn between Tableau and Power BI, our advice is: learn Power BI first if you’re in an Australian corporate environment (it’s more commonly used here), and add Tableau as a second skill to broaden your appeal.
- Best for: Advanced data visualisation, storytelling with data, consulting roles
- Difficulty: Intermediate
- Australian demand: Moderate to high, especially in larger enterprises and consulting firms
6. Google Looker Studio The Free Data Analytics Tool You Shouldn’t Ignore
Formerly known as Google Data Studio, Looker Studio is one of the most underrated data analytics tools on this list and it’s completely free. It connects natively to Google Analytics, Google Ads, Google Sheets, BigQuery, and dozens of other data sources, making it an ideal tool for marketing analysts, digital agencies, and small business owners across Australia who are working with Google ecosystem data.
Looker Studio is also growing rapidly in adoption. As more Australian businesses invest in digital marketing and online sales, the demand for analysts who can build Looker Studio dashboards to report on web performance, ad spend, and customer behaviour is increasing quickly. It’s an especially smart skill for anyone pursuing a career in marketing analytics or digital strategy.
- Best for: Marketing dashboards, Google ecosystem reporting, small business analytics
- Difficulty: Beginner to intermediate
- Australian demand: Growing fast, especially in marketing agencies, e-commerce, and digital roles in Brisbane and Adelaide
7. AI Analytics Tools The Future-Proof Skill Every Analyst Needs Now
The seventh entry on our data analytics tools list is a category rather than a single product and it’s the one that’s changing fastest. AI-powered analytics tools like Microsoft Copilot (built into Excel and Power BI), ChatGPT for data exploration, and platforms like Google’s Vertex AI and Amazon QuickSight Q are rapidly transforming how analysts work.
In 2026, Australian employers are starting to ask not just whether you know traditional data analytics tools, but whether you know how to use AI to accelerate your work. Analysts who can combine Python or SQL with AI tools to automate routine reporting, generate insights faster, and build smarter dashboards are in a category of their own when it comes to job applications and salary negotiations.
You don’t need to be an AI researcher to benefit from these tools but understanding how to prompt AI effectively, integrate it into your workflow, and use it to augment your existing data analytics tools is a skill set that will only become more valuable over the next few years.
- Best for: Automating reports, accelerating analysis, future-proofing your career
- Difficulty: Beginner to advanced (depending on the tool)
- Australian demand: Rapidly growing especially in tech companies, banking, and government in Canberra and Sydney
Your Beginner-to-Advanced Data Analytics Tools Learning Path
Not sure where to start with all these data analytics tools? Here’s the exact sequence we recommend to our students across Australia from complete beginners through to job-ready professionals:
Stage 1 — Beginner (Months 1–2): Excel + SQL
- Start with Excel to understand data fundamentals: cleaning, sorting, filtering, PivotTables, and basic charts
- Move into SQL to learn how to query databases, extract datasets, and write basic reports
- Goal: be able to clean a dataset, answer basic business questions, and produce a summary report
Stage 2 — Intermediate (Months 3–4): Power BI or Tableau + Looker Studio
- Add Power BI to build interactive dashboards from your SQL or Excel data
- Add Looker Studio if you’re heading toward a marketing or digital analytics role
- Goal: build a portfolio dashboard that shows real data in a professional, visual format
Stage 3 — Advanced (Months 5–6+): Python + AI Tools
- Learn Python fundamentals for data analytics: pandas, numpy, matplotlib, and basic machine learning
- Integrate AI tools into your workflow to accelerate analysis and automate reporting
- Goal: be able to handle large, messy datasets end-to-end and start applying for senior analyst roles
This path takes most dedicated part-time learners about 6 months to complete. All three stages are covered in detail through our courses at Data Analytics Courses AU.
Data Analytics Tools Comparison Table (2026)
Use this quick reference table to compare the top data analytics tools at a glance and decide which ones to focus on first:
| Tool | Difficulty | Cost | Best For | Salary Impact |
| Excel | Beginner | Paid (M365) | Reporting, cleaning | Moderate |
| SQL | Beginner+ | Free (many) | Databases, queries | High |
| Power BI | Intermediate | Free / Paid | Dashboards, BI | Very High |
| Python | Advanced | Free | Automation, ML | Very High |
| Tableau | Intermediate | Paid | Visualisation | High |
| Looker Studio | Beginner+ | Free | Marketing dash. | Moderate |
| AI Tools | All levels | Free / Paid | Automation, speed | High + growing |
Real Job Roles in Australia That Use These Data Analytics Tools
Understanding which data analytics tools matter is easier when you can see them in the context of real job roles. Here are three of the most common data analytics careers in Australia and the tools they use every day:
Data Analyst
This is the most common entry-level and mid-level role in the Australian analytics market. Data analysts typically use Excel and SQL daily for data cleaning and reporting, Power BI or Tableau to build dashboards, and increasingly Python to automate repetitive tasks. Data analyst roles are advertised heavily in Melbourne, Sydney, and Brisbane, with salaries typically ranging from $75,000 to $105,000.
Business Analyst
Business analysts focus more on translating data insights into business recommendations than on deep technical analysis. They tend to rely heavily on Excel, Power BI, and SQL, and often need strong presentation skills alongside their data analytics tools proficiency. Business analyst roles are available in virtually every Australian city and industry, from banking and insurance to retail and government.
Marketing Analyst
Marketing analysts use data analytics tools like Google Looker Studio, Excel, and SQL to measure campaign performance, customer behaviour, and ROI. Python is increasingly useful for marketing analytics automation, and AI tools are becoming standard for generating customer insights at scale. These roles are growing fast in Melbourne, Sydney, and Brisbane as Australian businesses invest more in digital marketing.
Frequently Asked Questions About Data Analytics Tools in Australia
Which data analytics tool should I learn first in Australia?
Start with Excel. It’s the most widely used of all the data analytics tools in Australian workplaces, it builds a strong foundation of data thinking, and it’s required in the vast majority of entry-level job ads. Once you’re comfortable, move to SQL as your second skill.
Do I need to know all 7 data analytics tools to get a job?
No. Most entry-level data analyst roles in Australia expect you to be proficient in two to four data analytics tools typically Excel, SQL, and one visualisation tool like Power BI or Tableau. Python and AI tools are valuable additions that will help you grow into more senior roles over time.
How long does it take to learn data analytics tools?
With focused, structured learning, most people can gain job-ready proficiency in the core data analytics tools (Excel, SQL, Power BI) within four to six months of part-time study. Our courses at Data Analytics Courses AU are designed around this timeline — practical, project-based, and built for working Australians.
Are these data analytics tools courses available online in Australia?
Yes. All the data analytics tools courses we offer at Data Analytics Courses AU are fully online and self-paced. Whether you’re in Melbourne, Sydney, Brisbane, Perth, Adelaide, or anywhere else in Australia, you can start learning today from your laptop at a time that suits you.
Recommended External Resources for Learning Data Analytics Tools
Alongside your structured course work, these resources are excellent for deepening your understanding of specific data analytics tools:
- Microsoft Learn — Official Power BI & Excel Training (free, official documentation and guided learning paths)
- Kaggle — Free Python & SQL Courses with Real Datasets (highly recommended for hands-on practice)
- Tableau Public — Free Visualisation Practice (build and share dashboards for your portfolio)
- Google Skillshop — Free Looker Studio Certification (official free certification from Google)
For a structured path through all these data analytics tools, our flagship program at Data Analytics Courses AU combines all seven tools into one cohesive, job-focused curriculum.