



The report builder trap is the quiet career stall that catches thousands of capable data professionals in Australia. You are good at your job. Your dashboards are clean, your SQL is solid, your Power BI reports load fast. Yet year after year, the promotion, the team lead title or the seat at the strategy table goes to someone else. If that sounds familiar, the problem is rarely your technical skill. It is how your work is positioned.
Here is the uncomfortable truth. Businesses are happy to keep paying a reliable report builder, but they rarely promote one into leadership. Leadership roles in data go to people who shape decisions, not just people who deliver outputs. This guide explains how the report builder trap works, the seven warning signs that you are inside it, and what top-performing analysts do differently to move into senior analyst, analytics manager and head of data roles.
What Is the Report Builder Trap in a Data Career?
The report builder trap describes a pattern where a data analyst becomes known purely as the person who builds what is asked for. A stakeholder sends a request, you build the report, you send it back, and the cycle repeats. Over time, your calendar fills with ad hoc requests, your reputation hardens into “the dashboard person”, and your scope never grows beyond delivery.
It feels productive, which is exactly why it is dangerous. You are busy, you are helpful and people thank you. But you are measured by output, such as the number of reports shipped, instead of outcomes, such as revenue protected, costs reduced or risks caught early. Leadership is judged on outcomes, so a career built on outputs hits a ceiling.
The good news is that the report builder trap is a habit and a positioning problem, not a talent problem. Once you can see it, you can step out of it, and you do not have to change employers to do so.
7 Signs You Are Caught in the Report Builder Trap
1. You are measured on reports delivered, not decisions improved
If your performance conversations focus on turnaround times and ticket counts, you are being managed as a service function. A Sydney analyst who closes forty requests a month looks efficient on paper but has no story about what changed because of her work. Leaders always have a story about impact.
2. You wait for requirements instead of shaping the question
Report builders ask “what columns do you want?” Top performers ask “what decision are you trying to make?” The second question changes the entire conversation. It moves you from order taker to advisor, and advisors are the people organisations promote.
3. Stakeholders treat you like a help desk
When every message starts with “can you quickly pull…”, you have become a self-service layer for other teams. That is useful for them, but it puts you at the edge of the business, not near the decisions. If nobody invites you to planning meetings, this is usually why.
4. You know your tools better than your business
Strong Power BI, SQL and Excel skills are essential, and they are the entry ticket. But leaders understand margins, customer behaviour, operational constraints and risk. If you cannot explain how your company makes money in two sentences, the report builder trap has you, no matter how advanced your DAX is.
5. Your work stops at the dashboard
A dashboard shows what happened. A recommendation says what to do next. Many analysts stop at the first and never practise the second, because it feels risky to have an opinion. Yet the opinion is exactly what leaders are paid for. Add a short “so what” and “now what” to every deliverable and you will stand out within weeks.
6. You avoid visibility and storytelling
Presenting to senior stakeholders can feel uncomfortable when you are more at home in a data model. But if executives never hear your voice, they cannot picture you leading. Data storytelling, clear slides and confident verbal summaries are core leadership skills, not optional extras.
7. You have no plan for the leadership skills you lack
Technical growth is easy to schedule: another course, another certification. Leadership growth is vaguer, so it gets postponed. Without a deliberate plan for stakeholder management, prioritisation, coaching and commercial thinking, the report builder trap quietly becomes a five-year pattern.
What Top Performers Do Differently to Escape the Report Builder Trap
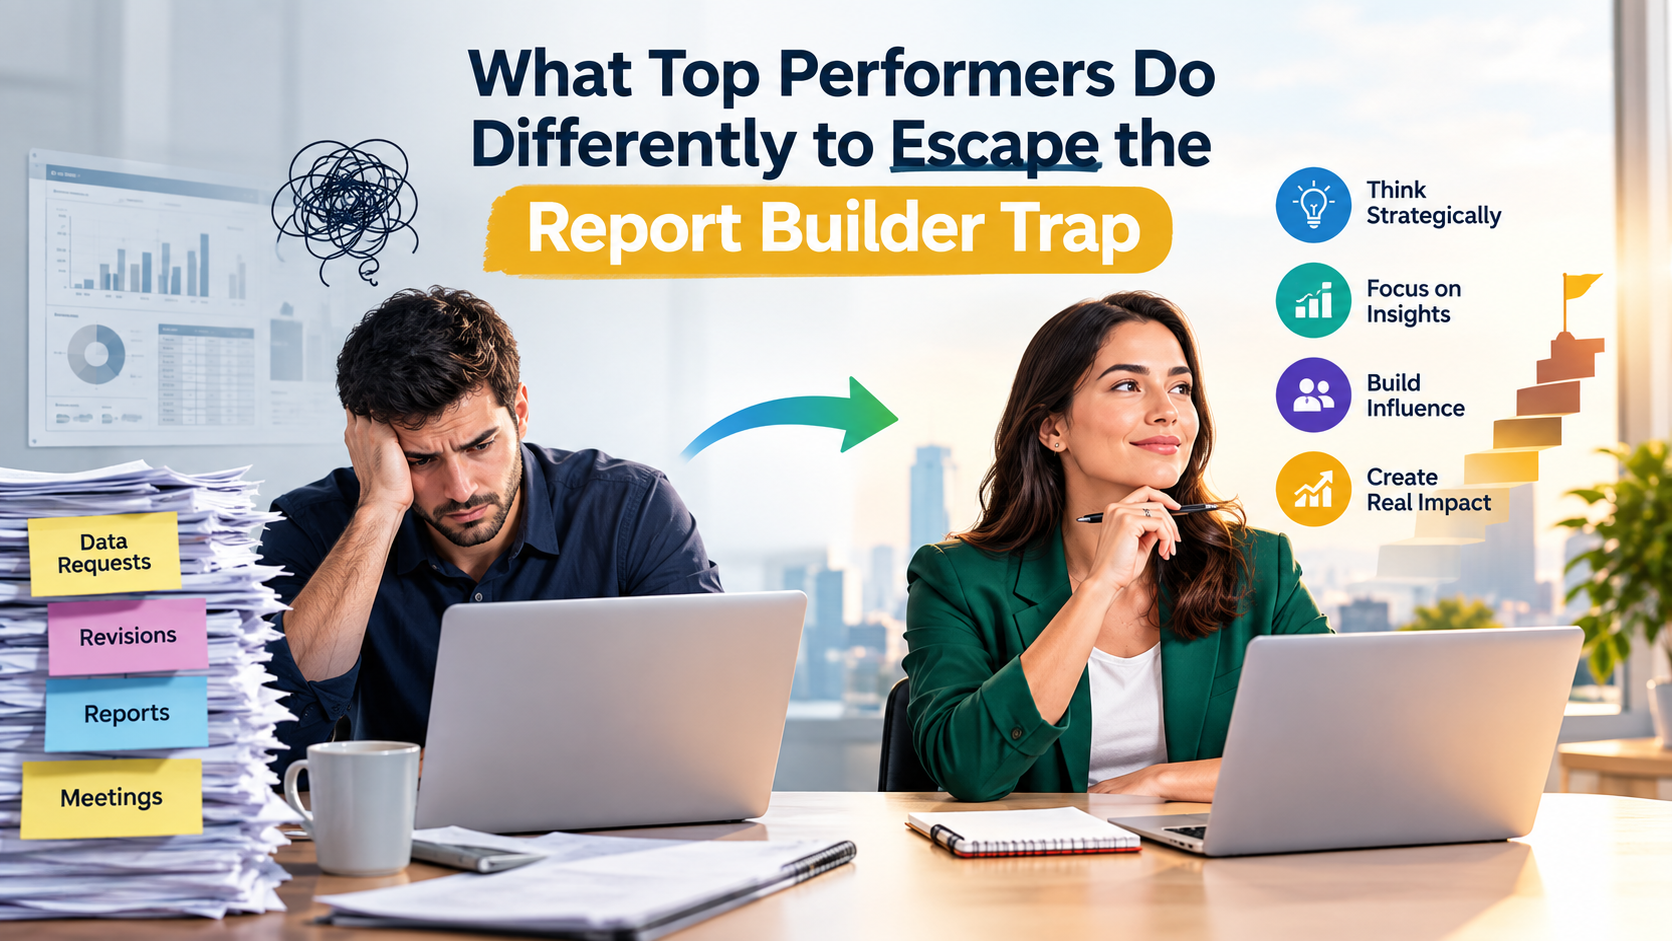
The analysts who reach leadership are not always the best technicians. They are the ones who changed how they work long before they changed their title. The table below shows the shift.
| Area | Report builder | Top performer |
| Starting point | Takes the request as written | Clarifies the decision behind the request |
| Deliverable | Dashboard or spreadsheet | Insight plus a clear recommendation |
| Stakeholders | Responds when asked | Builds relationships before they are needed |
| Business knowledge | Knows the data model | Knows revenue, cost and risk drivers |
| Communication | Sends files | Tells a short, confident story |
| Prioritisation | Says yes to everything | Ranks work by business value and says no well |
| Growth plan | More tools and certificates | Tools, commercial skills and people skills together |
Notice that none of these shifts require a new job title. They require a different way of showing up in the work you already do. That is why they are so powerful, and why the report builder trap is so escapable.
Why Companies Promote Decision Makers Over Report Builders
It helps to see this from the hiring manager’s side. A leadership role in data carries budget, headcount and accountability. The person in that seat has to defend priorities, say no to low-value requests and explain results to executives who have five minutes and no patience for jargon.
Someone who has spent years inside the report builder trap rarely has evidence of any of that. Their track record shows delivery, which is valuable, but not judgement. By contrast, an analyst who can point to a pricing change, a churn reduction or a cost saving that started with their insight is already behaving like a leader. The title simply catches up later.
That is also why job moves can fail to fix the problem. If you take the same working habits to a new employer, the report builder trap follows you. Changing how you work first gives you the leverage to change roles on better terms.
The Skills Data Leaders Actually Need in Australia
Technical depth still matters, because credibility comes from being right. But the mix of skills changes as you move up. Think of it as three layers.
- Technical foundation: SQL for data analysis, Power BI modelling and DAX, data warehousing concepts and increasingly Microsoft Fabric and Azure data services. Employers across Australia still screen heavily on these.
- Business and commercial skills: understanding KPIs, forecasting, cost drivers, customer lifetime value and how decisions are really made inside your industry.
- Leadership skills: stakeholder management, prioritisation, coaching junior analysts, influencing without authority and presenting to executives.
Most training only covers the first layer, which is one reason the report builder trap is so common. Structured learning in the technical layer is the fastest way to free up time and confidence for the other two. Our Power BI training, Azure data certifications and the wider data analytics course library are built to give you that foundation in a practical, job-focused way.
A 90-Day Plan to Break Out of the Report Builder Trap
You do not need permission to start. Use this plan alongside your current role.
| Phase | Focus | What to do |
| Days 1 to 30 | Reposition your work | Ask the “what decision?” question on every request. Add a one-line recommendation to each report. Track which of your insights led to action. |
| Days 31 to 60 | Build business depth | Book a 30-minute chat with a finance, sales or operations lead each fortnight. Learn their KPIs and pain points. Fill any technical gaps with targeted SQL or Power BI training. |
| Days 61 to 90 | Lead visibly | Present one insight to a senior audience. Mentor a junior colleague. Propose a small analytics project with a measurable outcome and own it end to end. |
By the end of the 90 days you will have a portfolio of outcomes, a stronger network and a clear story for your next performance review or interview. That is the evidence leaders look for.
The Typical Data Career Path: From Analyst to Head of Data
Knowing the ladder helps you aim at the right rung. Titles vary between employers, but the progression looks like this in most Australian organisations.
| Level | Typical focus | What gets you promoted |
| Data or reporting analyst | Building reports and cleaning data | Accuracy, speed and strong core tools |
| Senior data analyst | Owning analysis and advising stakeholders | Insight quality and business understanding |
| Analytics lead | Setting standards, mentoring, prioritising | Influence, coaching and delivery of outcomes |
| Analytics manager | Managing a team and a roadmap | Stakeholder trust and team results |
| Head of data or analytics | Strategy, investment and governance | Commercial impact and executive credibility |
The biggest jump is between senior analyst and analytics lead. That is where the report builder trap does the most damage, because it is the point where your reputation, not your skill, decides the outcome.
The Report Builder Trap Across Australian Cities
The trap looks slightly different depending on where you work, because each city has its own mix of industries and data teams.
- Sydney: banking, insurance and consulting teams are large and specialised. It is easy to get boxed into one reporting function, so visible cross-team projects matter.
- Melbourne: a strong mix of retail, health and tech. Analysts who combine data skills with product or customer thinking move up fastest.
- Brisbane and the Gold Coast: growing infrastructure, government and tourism data teams. Smaller teams mean leadership opportunities open earlier for those who step up.
- Perth: mining and resources organisations value analysts who can link data to operational and safety outcomes, not just production reports.
- Adelaide: defence, health and education sectors reward analysts who understand governance and can explain data clearly to non-technical teams.
- Canberra: the federal public service values analysts who can write policy-ready insights. Moving from reports to briefings is the big leadership step.
Wherever you are, the way out of the report builder trap is the same: move from delivering reports to influencing decisions.
Courses and Certifications That Help You Move Beyond Reporting
Certifications will not make you a leader on their own, but they remove technical friction so you can spend your energy on the skills that matter. These are the pathways Australian data professionals ask about most.
- Power BI and PL-300: the core credential for Microsoft-focused teams. Explore our Power BI course and the official Microsoft PL-300 certification page.
- SQL for Data Analysis: the single most valuable technical skill for analysts, and the one hiring managers test first. See the options at Logitrain.
- Azure Data Fundamentals (DP-900): builds cloud and data platform knowledge that senior roles expect. Find it through Azure certifications.
- CompTIA Data+ and BCS Professional Certificate: vendor-neutral options that strengthen your data literacy and governance understanding. Check current availability at Logitrain.
If you are not sure where to start, our data analytics courses team can help you match a pathway to your current role and goals.
Quick Self-Audit: Are You Stuck in the Report Builder Trap?
Be honest with yourself. Each “no” shows where to focus first.
- Do you regularly ask what decision a report will support before you build it?
- Does every deliverable include a clear recommendation?
- Can you explain your company’s top three revenue or cost drivers?
- Have you presented to a senior leader in the last three months?
- Do you have a plan for leadership skills, not just technical ones?
- Can you name a business outcome your work influenced this year?
If you answered no to three or more, the report builder trap is probably holding your career back, and the 90-day plan above is your starting point.
Frequently Asked Questions
What is the report builder trap?
It is a career pattern where a data professional is valued mainly for producing reports on request. They stay busy and useful but are rarely seen as a strategic voice, so promotions to leadership roles go elsewhere.
Can a data analyst become a manager without a degree in management?
Yes. Many analytics managers in Australia grew from analyst roles. What counts is a track record of business outcomes, stakeholder trust and the ability to coach others, backed by solid technical skills.
Which technical skills matter most for data leadership?
SQL, Power BI and data modelling remain the foundation, with growing demand for Azure and Microsoft Fabric knowledge. Beyond tools, commercial thinking and communication become the deciding factors.
How long does it take to escape the report builder trap?
Most people notice a change in how colleagues treat them within 60 to 90 days of changing how they scope and present their work. A formal promotion usually follows over the next 6 to 18 months, depending on the organisation.
Do certifications help with leadership roles?
They help with credibility and free up time by deepening your technical confidence. They work best when paired with visible business impact and leadership practice.
Stop Building Reports. Start Shaping Decisions.
The report builder trap is not a verdict on your ability. It is a pattern you can break with small, consistent changes in how you question, deliver and communicate your work. Pair that with the right technical foundation and you become the analyst leaders want to promote.
Ready to strengthen your skills? Browse our data analytics courses, explore the Power BI course, or look at Azure data certifications to build the foundation that supports your next step. You can also see the full range of IT training at Logitrain.