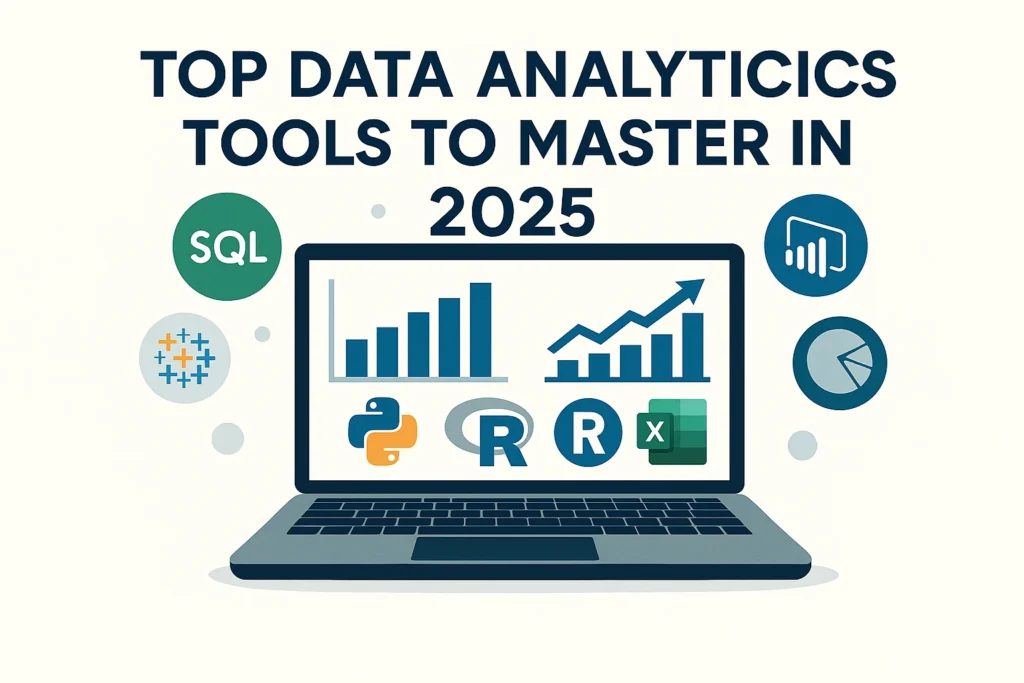
Data analytics is more than just understanding numbers. It’s about transforming raw data into actionable insights. The right tools allow you to clean, model, and visualize data efficiently, enabling smarter business decisions.
Must-Learn Tools in 2025
-
SQL (Structured Query Language)
SQL remains the backbone of data management. It allows you to extract and manipulate data from databases, making it an essential skill for any analyst.
-
Python
Python is versatile for statistical analysis, machine learning, and automation. Libraries like Pandas, NumPy, and Matplotlib make data manipulation and visualization seamless.
-
R
Popular in academia and research, R is perfect for statistical computing and data visualization. It complements Python and is often used in predictive modeling.
-
Excel
Excel remains a fundamental tool for beginners and advanced users alike. From pivot tables to macros, Excel offers quick insights and easy reporting.
-
Tableau
Tableau turns complex data into interactive visualizations, helping stakeholders make decisions at a glance.
-
Power BI
Power BI integrates with Microsoft tools and enables real-time dashboards for business intelligence purposes.
-
Google Data Studio
A free, powerful visualization tool for reporting and dashboards, widely used in digital marketing and business analytics.
How to Get Started
Enroll in structured courses that cover these tools hands-on. Start with SQL and Excel for foundational knowledge, then expand to Python, R, and visualization platforms.
Frequently Asked Questions (FAQs)
1. Do I need a technical background to learn these tools?
2. Which tool should I learn first?
3. Can these tools help me get a high-paying job?
Ready to Master Data Analytics Tools?
Start learning data analytics with hands-on courses covering SQL, Python, R, Power BI, Tableau, and more.


